Class Notes in Statistics and Econometrics Part 5 pps
Class Notes in Statistics and Econometrics Part 5 pps
... Ψ
1
=
0.62 −0 .56
−0 .56 1.04
, Ψ
2
=
1. 85 1.67
1.67 3.12
, Ψ
3
=
0.62 0 .56
0 .56 1.04
, Ψ
4
=
1. 85 −1.67
1.67 3.12
,
Ψ
5
=
3.12 −1.67
−1.67 1. 85
, Ψ
6
=
1.04 0 .56
0 .56 0.62
, ... vertical band
between 0.4 and 2.6 and the horizontal band between 3 and -1 roughly have the same probability
as the ellipse, namely 95% . Since a univariate Normal has 95%...
Class Notes in Statistics and Econometrics Part 4 pps
... cases:
(8.0.9)
Second Flip
H T sum
First H . 25 . 25 .50
Flip T . 25 . 25 .50
sum .50 .50 1.00
Second Flip
H T sum
First H .50 .00 .50
Flip T .00 .50 .50
sum .50 .50 1.00
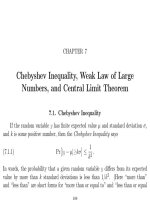
The most important case is that ... = 30 and var[x] = 180 · (5/ 36) = 25. Therefore define y ∼ N(30, 25) . The
CLT says that Pr[x≥ 25] ≈ Pr[y≥ 25] . Now y≥ 25 ⇐⇒ y − 30≥ − 5 ⇐⇒ y − 30≤ + 5 ⇐⇒
(y −30) /5 1. Bu...
Class Notes in Statistics and Econometrics Part 12 ppsx
... lefthand side; it is amazing and surprising that it is exactly the population
equivalent of the F -test for testing α = 0 in the regression with intercept. It can be estimated by
replacing α
2
with ... the
following:
Theorem 24.2.2.
ˆ
β is a linear minimax est imator of the parameter vector β
in the following sense: for every nonrandom coefficient vector t, t
ˆ
β is the linear
640 24. S...

Class Notes in Statistics and Econometrics Part 13 pps
... defined in Rao [Rao73, pp. 65 66], and
part of the following proof draws on a private communication of C. R. Rao regarding
consistency of equation (1f.3.4) in [Rao73, p. 65] .
Proof of theorem 25. 2.3: ... true β. Barnard’s s uggestion has not found entrance into the
textbooks and indeed, since linear estimators in model ( 25. 0.12) are unbiased if and
only if they have bounded MS...

Class Notes in Statistics and Econometrics Part 14 ppsx
... best linear bounded MSE predictor of z based on y, µ, and ν.
• a. Give special cases of this specification in which µ and ν are constant and y
and z random, and one in which µ and ν and y are random ... are random and z is constant, and
one in which µ and ν are random and y and z are constant.
27.1. MINIMUM MEAN SQUARED ERROR, UNBIASEDNESS NOT REQUIRED 713
informa...

Class Notes in Statistics and Econometrics Part 17 pps
... searches for an interesting and informative projec-
tion of the data by maximizing a criterion function. A logical candidate would for
instance be the variance ratio as defined in (8.6.7), but ... size (both within • and ◦ and also between these groups);
• negative relationship, between groups, of seed size and height;
• p osit ive relationship of height and lodging (within ◦ and...

Class Notes in Statistics and Econometrics Part 18 pps
... between
0. 75 and 0. 95, and there is a 50 -50 chance that it lies above or below 0. 85. The least
squares estimate of the MPC is 0.9, with a reasonable confidence interval. There is
no multicollinearity involved, ... vector, since we follow the “column vector convention.” The (marginal)
855
35. LEAST SQUARES AS THE NORMAL MAXIMUM LIKELIHOOD ESTIMATE 857
If we replace β in the log...

Class Notes in Statistics and Econometrics Part 20 pps
... even start to prove it. There is a proof in
[Kme86, pp. 749– 757 ], and one in [Mal80, pp. 53 5 53 9].
Problem 411. Since least squares with random regressors is appropriate when-
ever the disturbances ... Scenario: Minimizing relative increase in Mahalanobis
distance i f distribution is known
We start with a situation where the e xpec ted values of the random vectors y and
z are k...

Class Notes in Statistics and Econometrics Part 29 ppsx
... points for 0.0 05%
F
(5, 15; 0.0 05)
= 5. 37 (which g ives a two-sided 1% significance level), for 1% it is F
(5. 15; 0.01)
= 4 .56
(which gives a two-sided 2% significance level), for 2 .5% F
(5, 15; 0.0 25)
= ... 2 .5% point one
can also use the Splus-command qf(1 -5/ 200 ,5, 15) . One can also get the lower significance points
simply by the command qf (5/ 200 ,5, 15) . The test is the...

Class Notes in Statistics and Econometrics Part 34 pps
... back, and you regress y on X with a constant term. (The under-
lining does not denote taking out of the mean, but the taking out of the seasonal
means and adding back of the overall mean.) In the ... draw causal
inferences from his or her data, and the discussion of causality should be included in
statistics textbooks.
Innovation accounting or impulse response functions: make a mo...
Từ khóa:
- Báo cáo thực tập tại nhà thuốc tại Thành phố Hồ Chí Minh năm 2018
- Nghiên cứu sự biến đổi một số cytokin ở bệnh nhân xơ cứng bì hệ thống
- Nghiên cứu tổ chức pha chế, đánh giá chất lượng thuốc tiêm truyền trong điều kiện dã ngoại
- Nghiên cứu vật liệu biến hóa (metamaterials) hấp thụ sóng điện tử ở vùng tần số THz
- đề thi thử THPTQG 2019 toán THPT chuyên thái bình lần 2 có lời giải
- Giáo án Sinh học 11 bài 13: Thực hành phát hiện diệp lục và carôtenôit
- Giáo án Sinh học 11 bài 13: Thực hành phát hiện diệp lục và carôtenôit
- ĐỒ ÁN NGHIÊN CỨU CÔNG NGHỆ KẾT NỐI VÔ TUYẾN CỰ LY XA, CÔNG SUẤT THẤP LPWAN
- Phát triển mạng lưới kinh doanh nước sạch tại công ty TNHH một thành viên kinh doanh nước sạch quảng ninh
- Phát hiện xâm nhập dựa trên thuật toán k means
- Nghiên cứu, xây dựng phần mềm smartscan và ứng dụng trong bảo vệ mạng máy tính chuyên dùng
- Định tội danh từ thực tiễn huyện Cần Giuộc, tỉnh Long An (Luận văn thạc sĩ)
- Tìm hiểu công cụ đánh giá hệ thống đảm bảo an toàn hệ thống thông tin
- Chuong 2 nhận dạng rui ro
- Tổ chức và hoạt động của Phòng Tư pháp từ thực tiễn tỉnh Phú Thọ (Luận văn thạc sĩ)
- Kiểm sát việc giải quyết tố giác, tin báo về tội phạm và kiến nghị khởi tố theo pháp luật tố tụng hình sự Việt Nam từ thực tiễn tỉnh Bình Định (Luận văn thạc sĩ)
- Tăng trưởng tín dụng hộ sản xuất nông nghiệp tại Ngân hàng Nông nghiệp và Phát triển nông thôn Việt Nam chi nhánh tỉnh Bắc Giang (Luận văn thạc sĩ)
- Giáo án Sinh học 11 bài 15: Tiêu hóa ở động vật
- Giáo án Sinh học 11 bài 14: Thực hành phát hiện hô hấp ở thực vật
- Giáo án Sinh học 11 bài 14: Thực hành phát hiện hô hấp ở thực vật